With over 15 Years of experience in the Oil and Gas industry serving customers across upstream, midstream and downstream, and across Industry sectors, we use Data Science to help organizations to understand what happened, what could happen, and what should happen?

BUSINESS INTELLIGENCE
Embrace self service reporting, dashboards and visualization for decision support

DATA ENGINEERING
Establish a scalable, process efficient data platform to facilitate Data Science and Analytics

ADVANCED ANALYTICS
Enhance the process of decision making through predictive and prescriptive analytics

COLLECT & STORE
Extensible platform to support a wide array of data sources

TRANSFORM
Application of data mining and refining techniques

ENRICH
Make data meaningful to the extent you desire
The concept of applying data engineering principles to create a data platform is key to establishing a successful data science practice. The wide array of data sources would include transaction data, sensors, IOT, logs and data streams/feeds. The exploration and transformation of datasets are handled using platform specific data pipelines. The datasets are further enriched to have a semantic model for efficient analysis in a structured format.

REPORTING
Establish a Reporting Platform

DASHBOARDS
Executive, Operational and Reactive Dashboards

VISUALIZATION
Effective and Representative
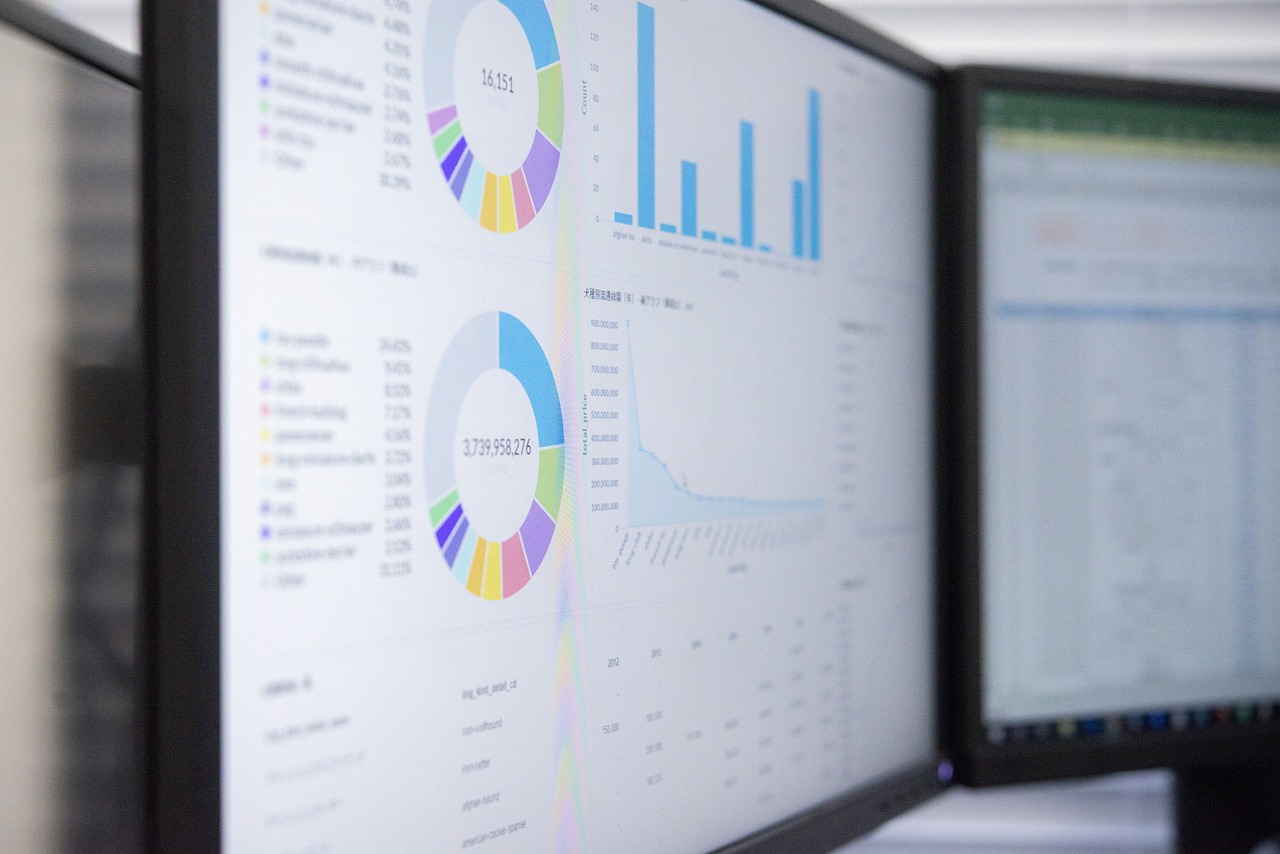
Business intelligence-drive business intelligence reporting through self-service methods with an effective data governance. Metrics, performance and overview through drill-down dashboards. Advanced visualization techniques for better interpretation

DESCRIPTIVE
Gain Insights from historical trends

PREDICTIVE
Forecast the likelihood of future outcomes

PRESCRIPTIVE
Optimize for best outcomes
Advanced analytics - descriptive analytics drills down into data to uncover details such as the frequency of events, the cost of operations and the root cause of failures. Predictive analytics provides answers that move beyond using historical data as the principal basis for decisions. Prescriptive analytics provides recommendation for better outcomes.